GHG Emissions Visualization
Data Visualization of Industrial Emissions
Research Figure Design / Scientific Data Visualization
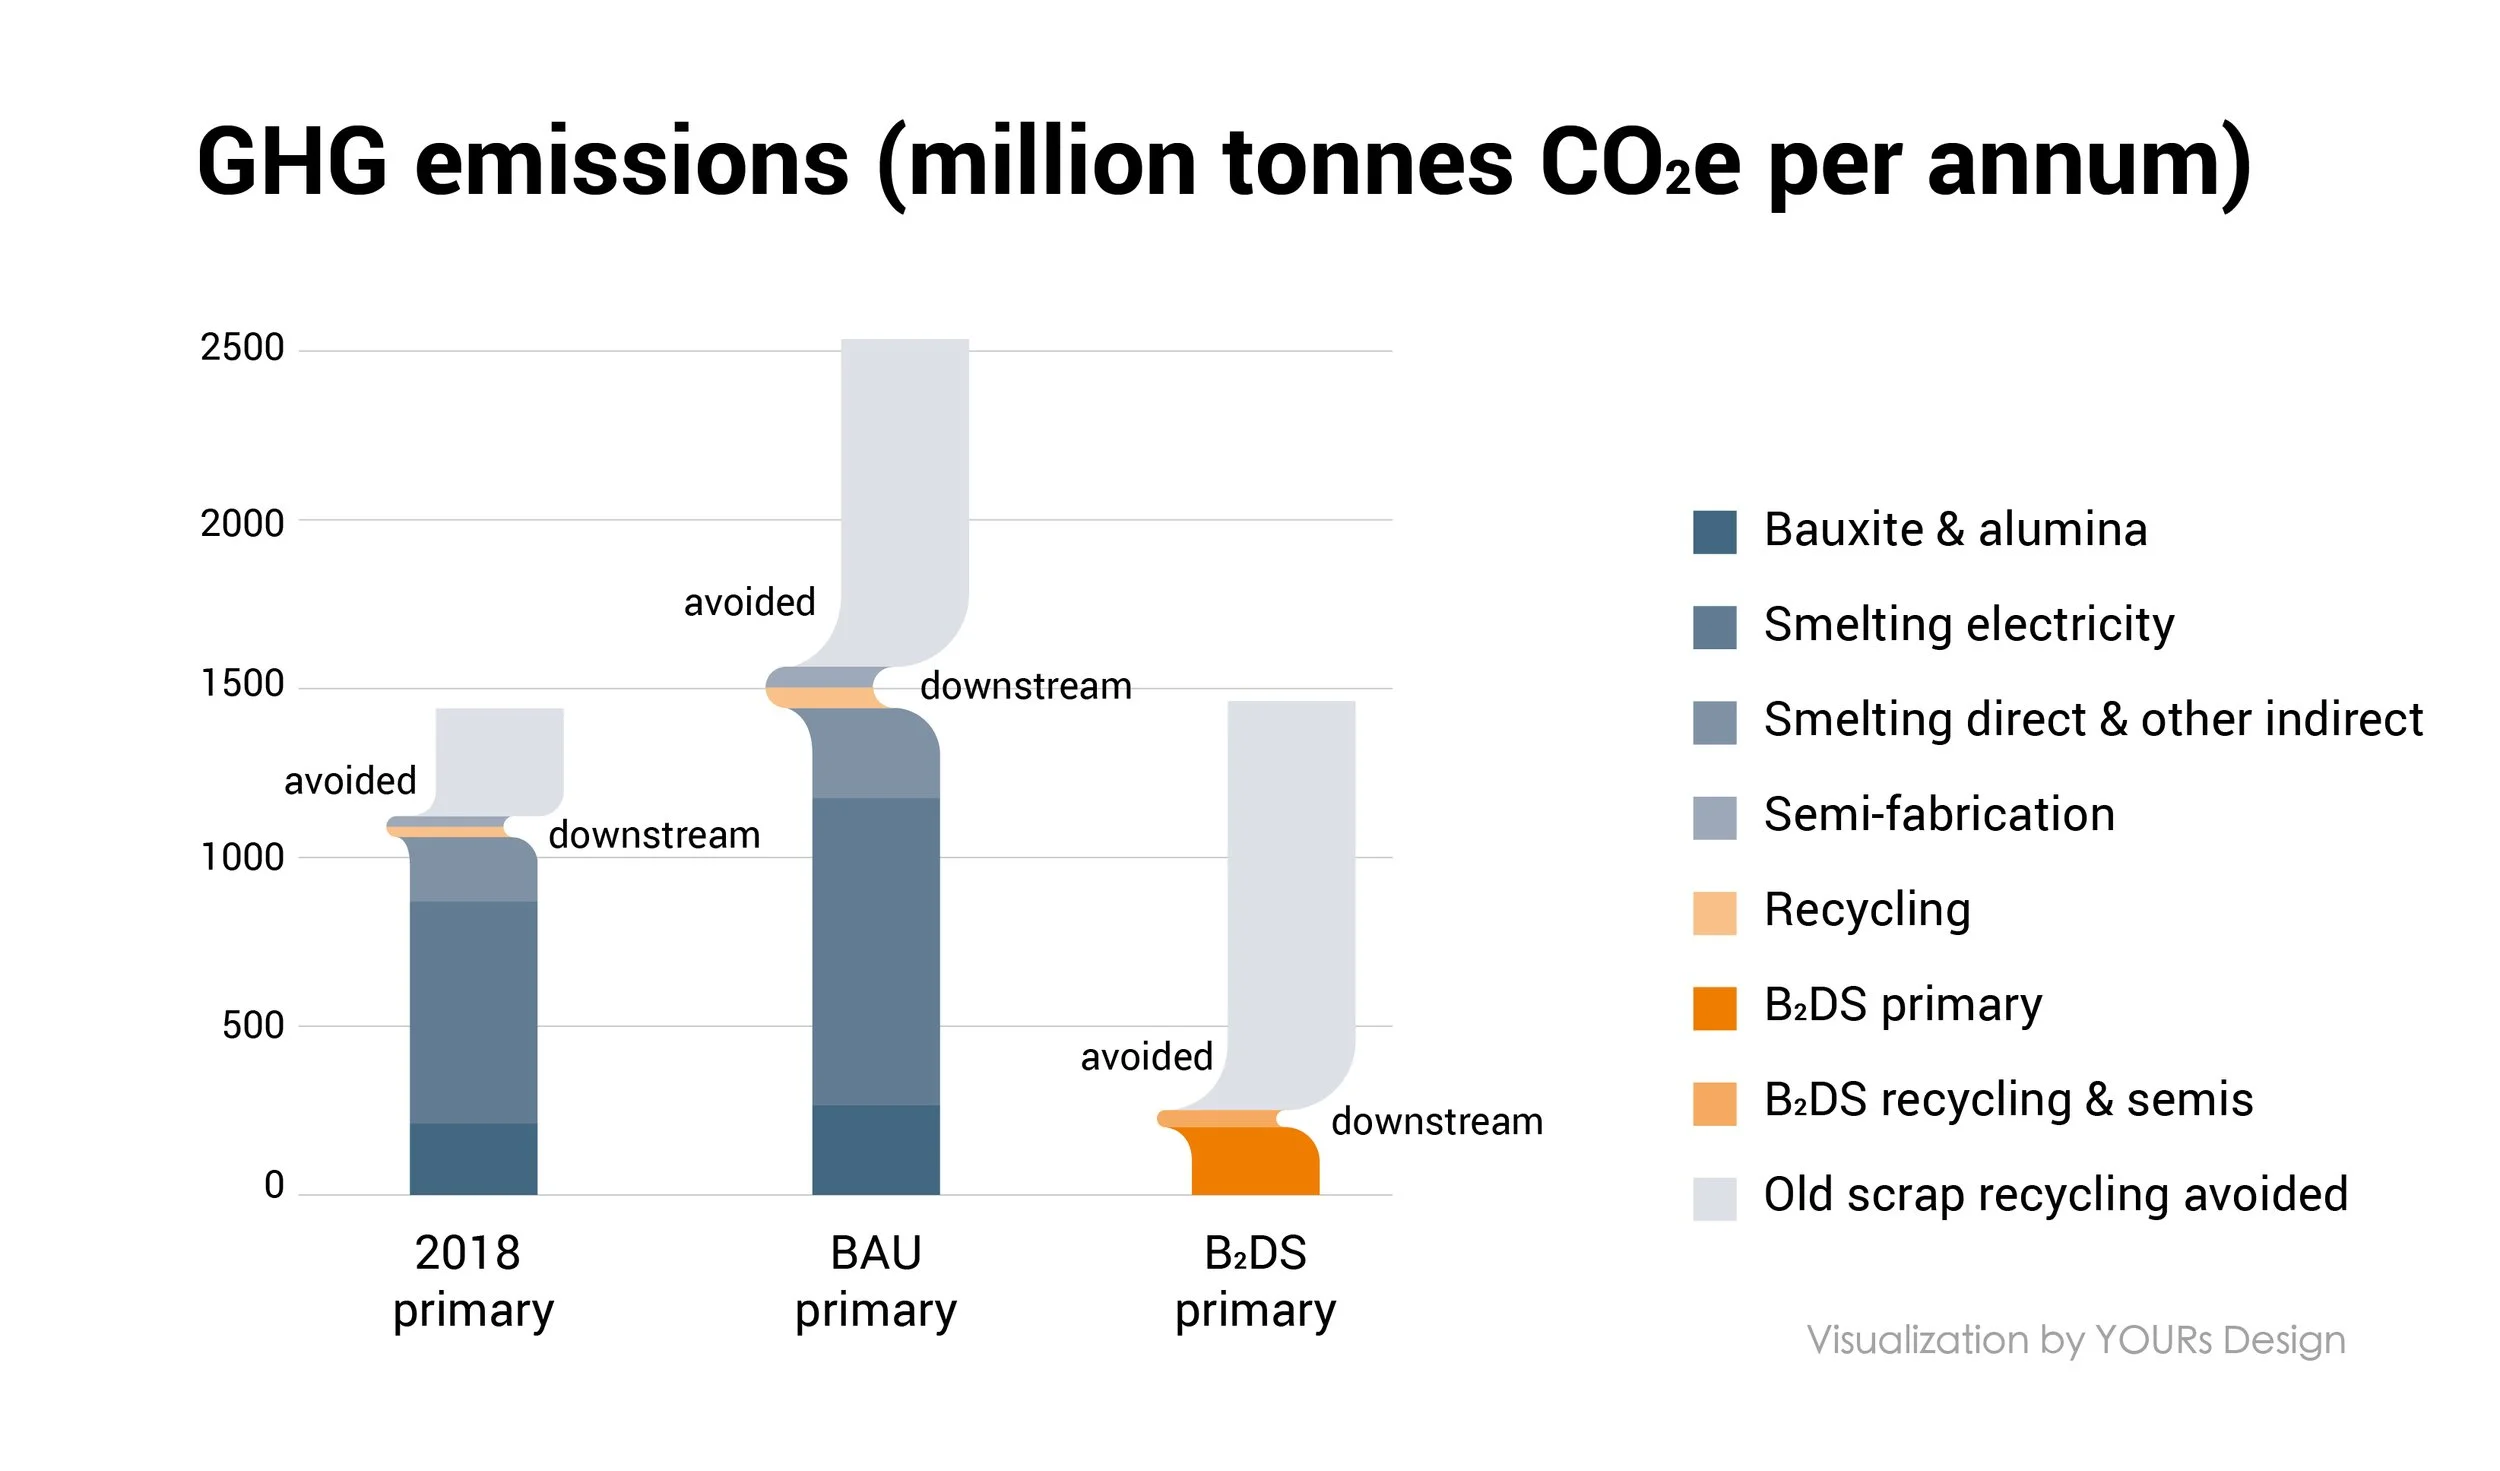
The challenge: Compare emissions across three production scenarios while also showing where they occur in the value chain — and how much is avoided through recycling — without the "avoided" story disappearing inside the totals.
The approach: Each bar layers the value-chain stages, from bauxite extraction through smelting to fabrication. Avoided emissions and downstream impact break from that stack entirely — rendered as a soft, funnel-like flare rather than another flat segment — so recycling's effect reads as something released from the production total, not just another number stacked on top.
The result: A chart that makes both the emissions footprint and the impact of circular material flows legible at a glance, supporting scenario-based reporting on aluminum's decarbonization pathways.
Similar projects
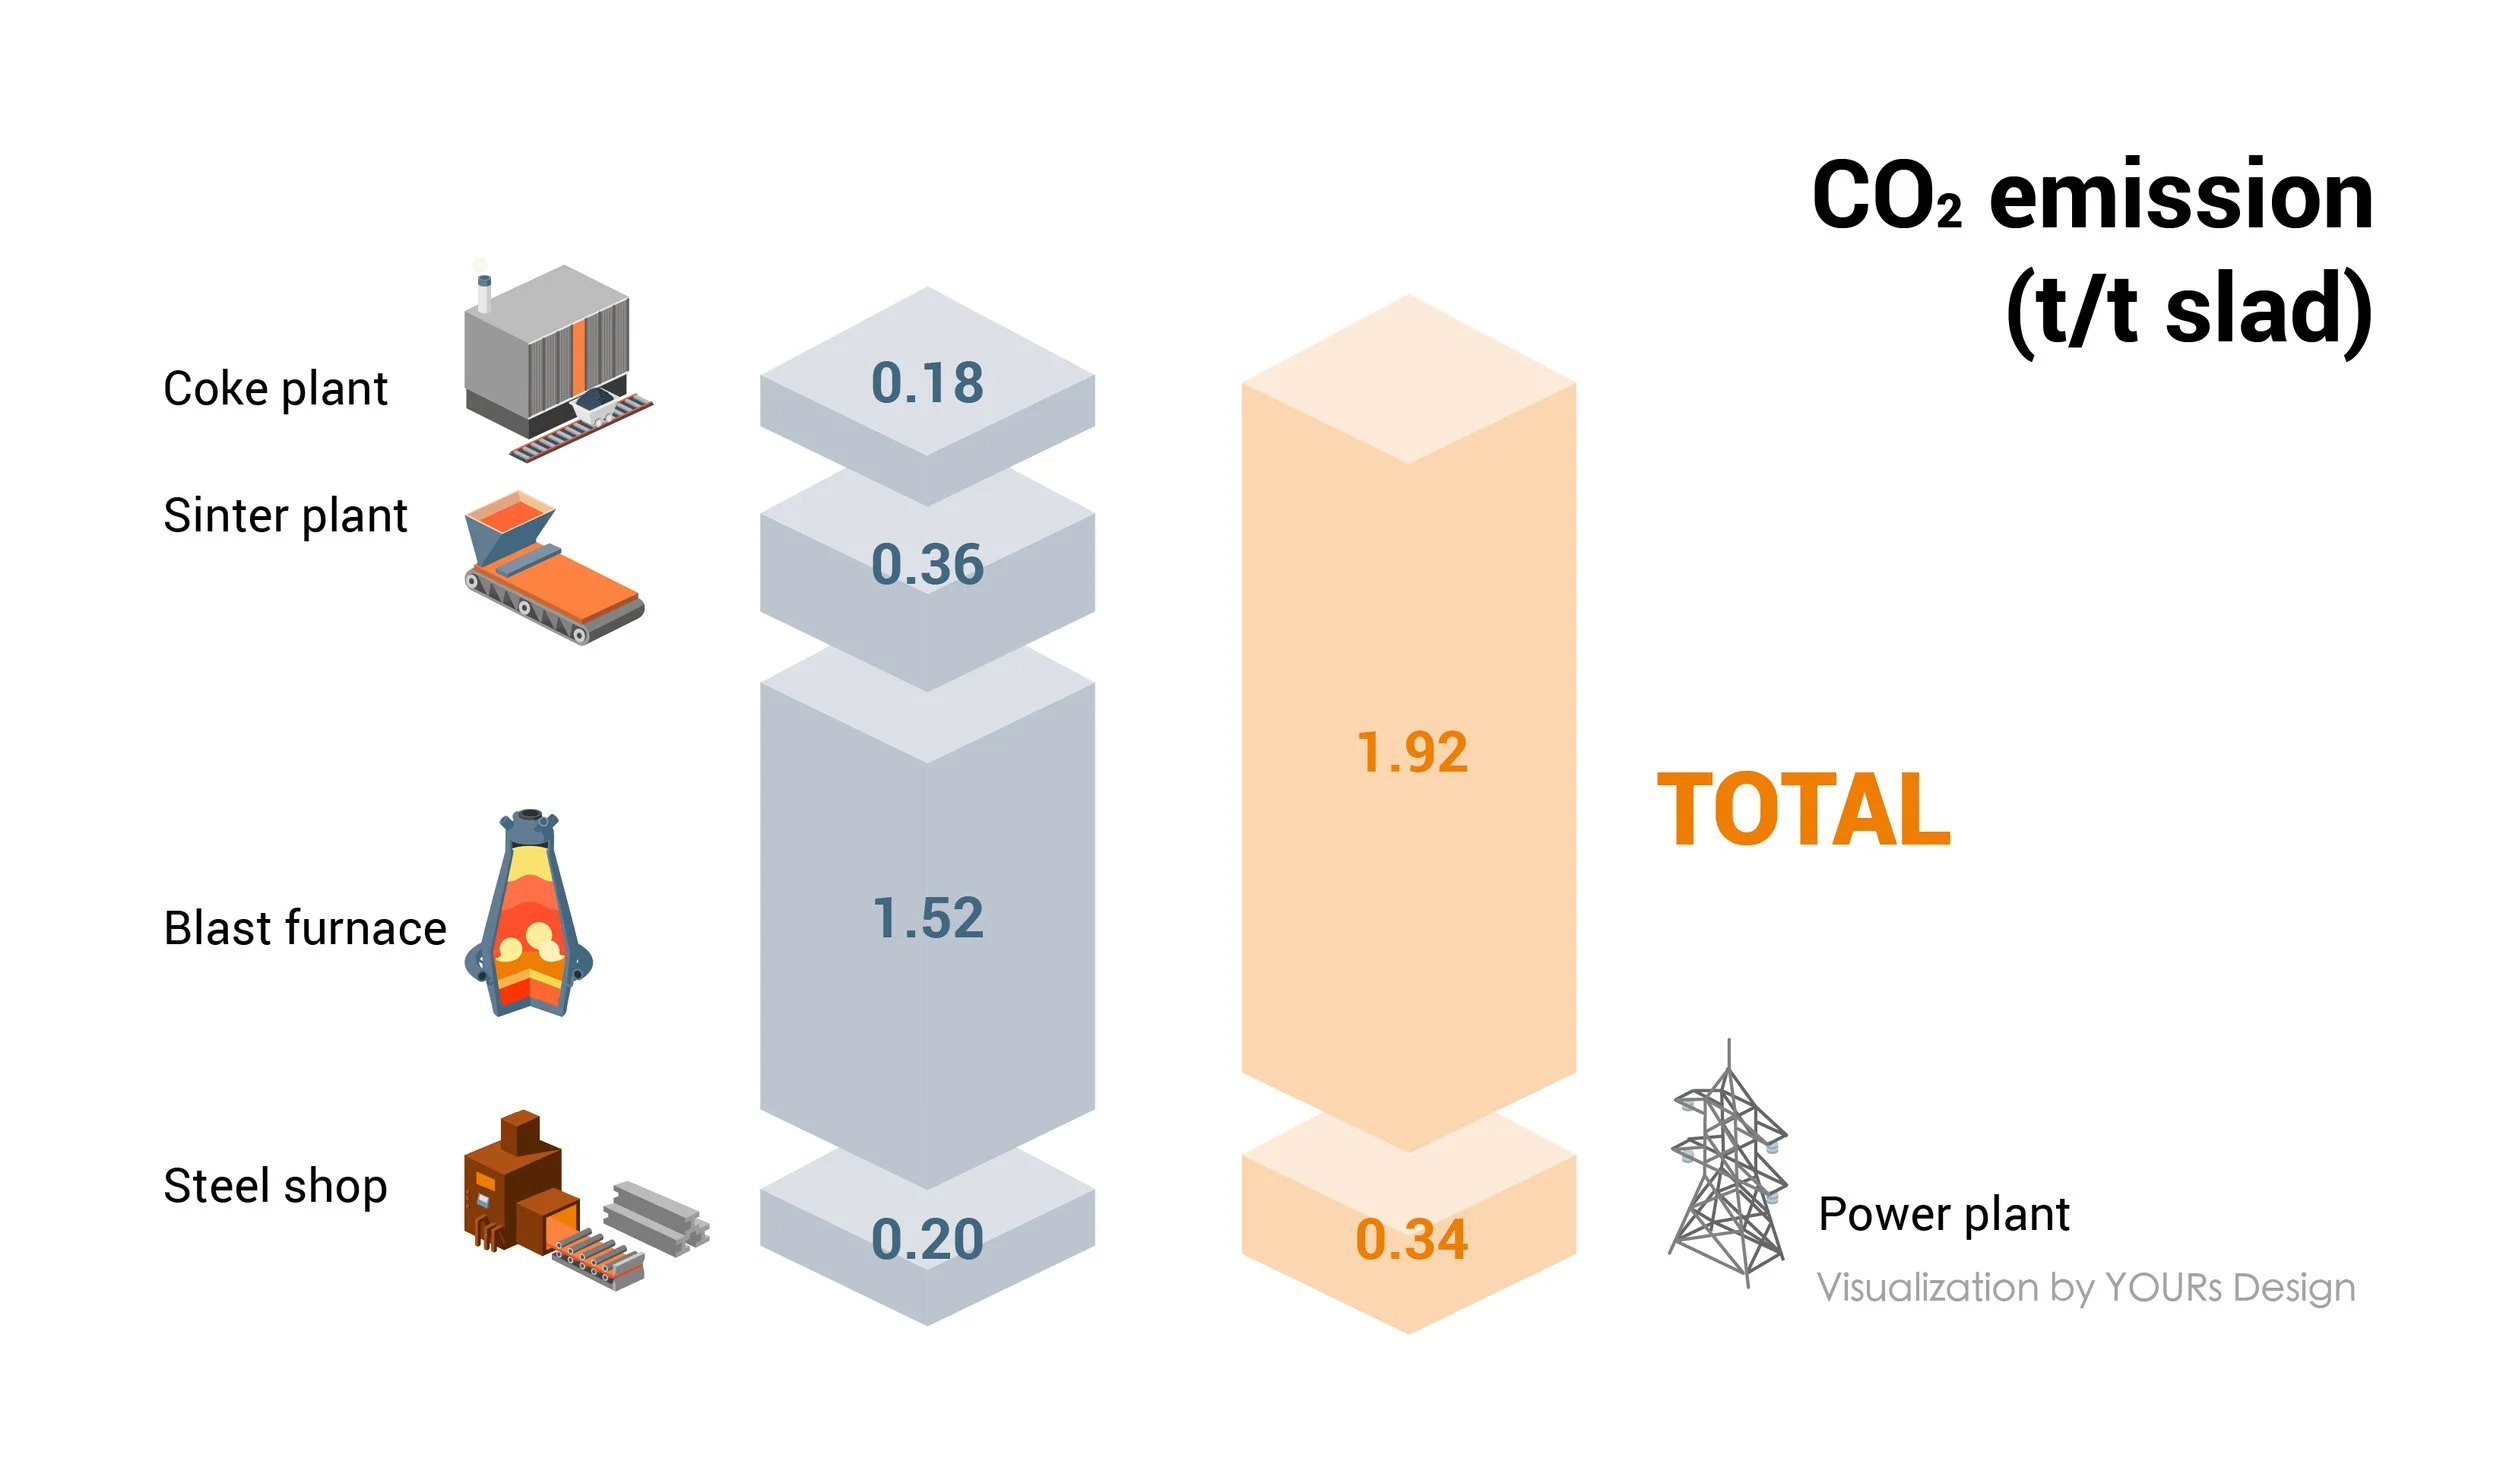
CO2 emission
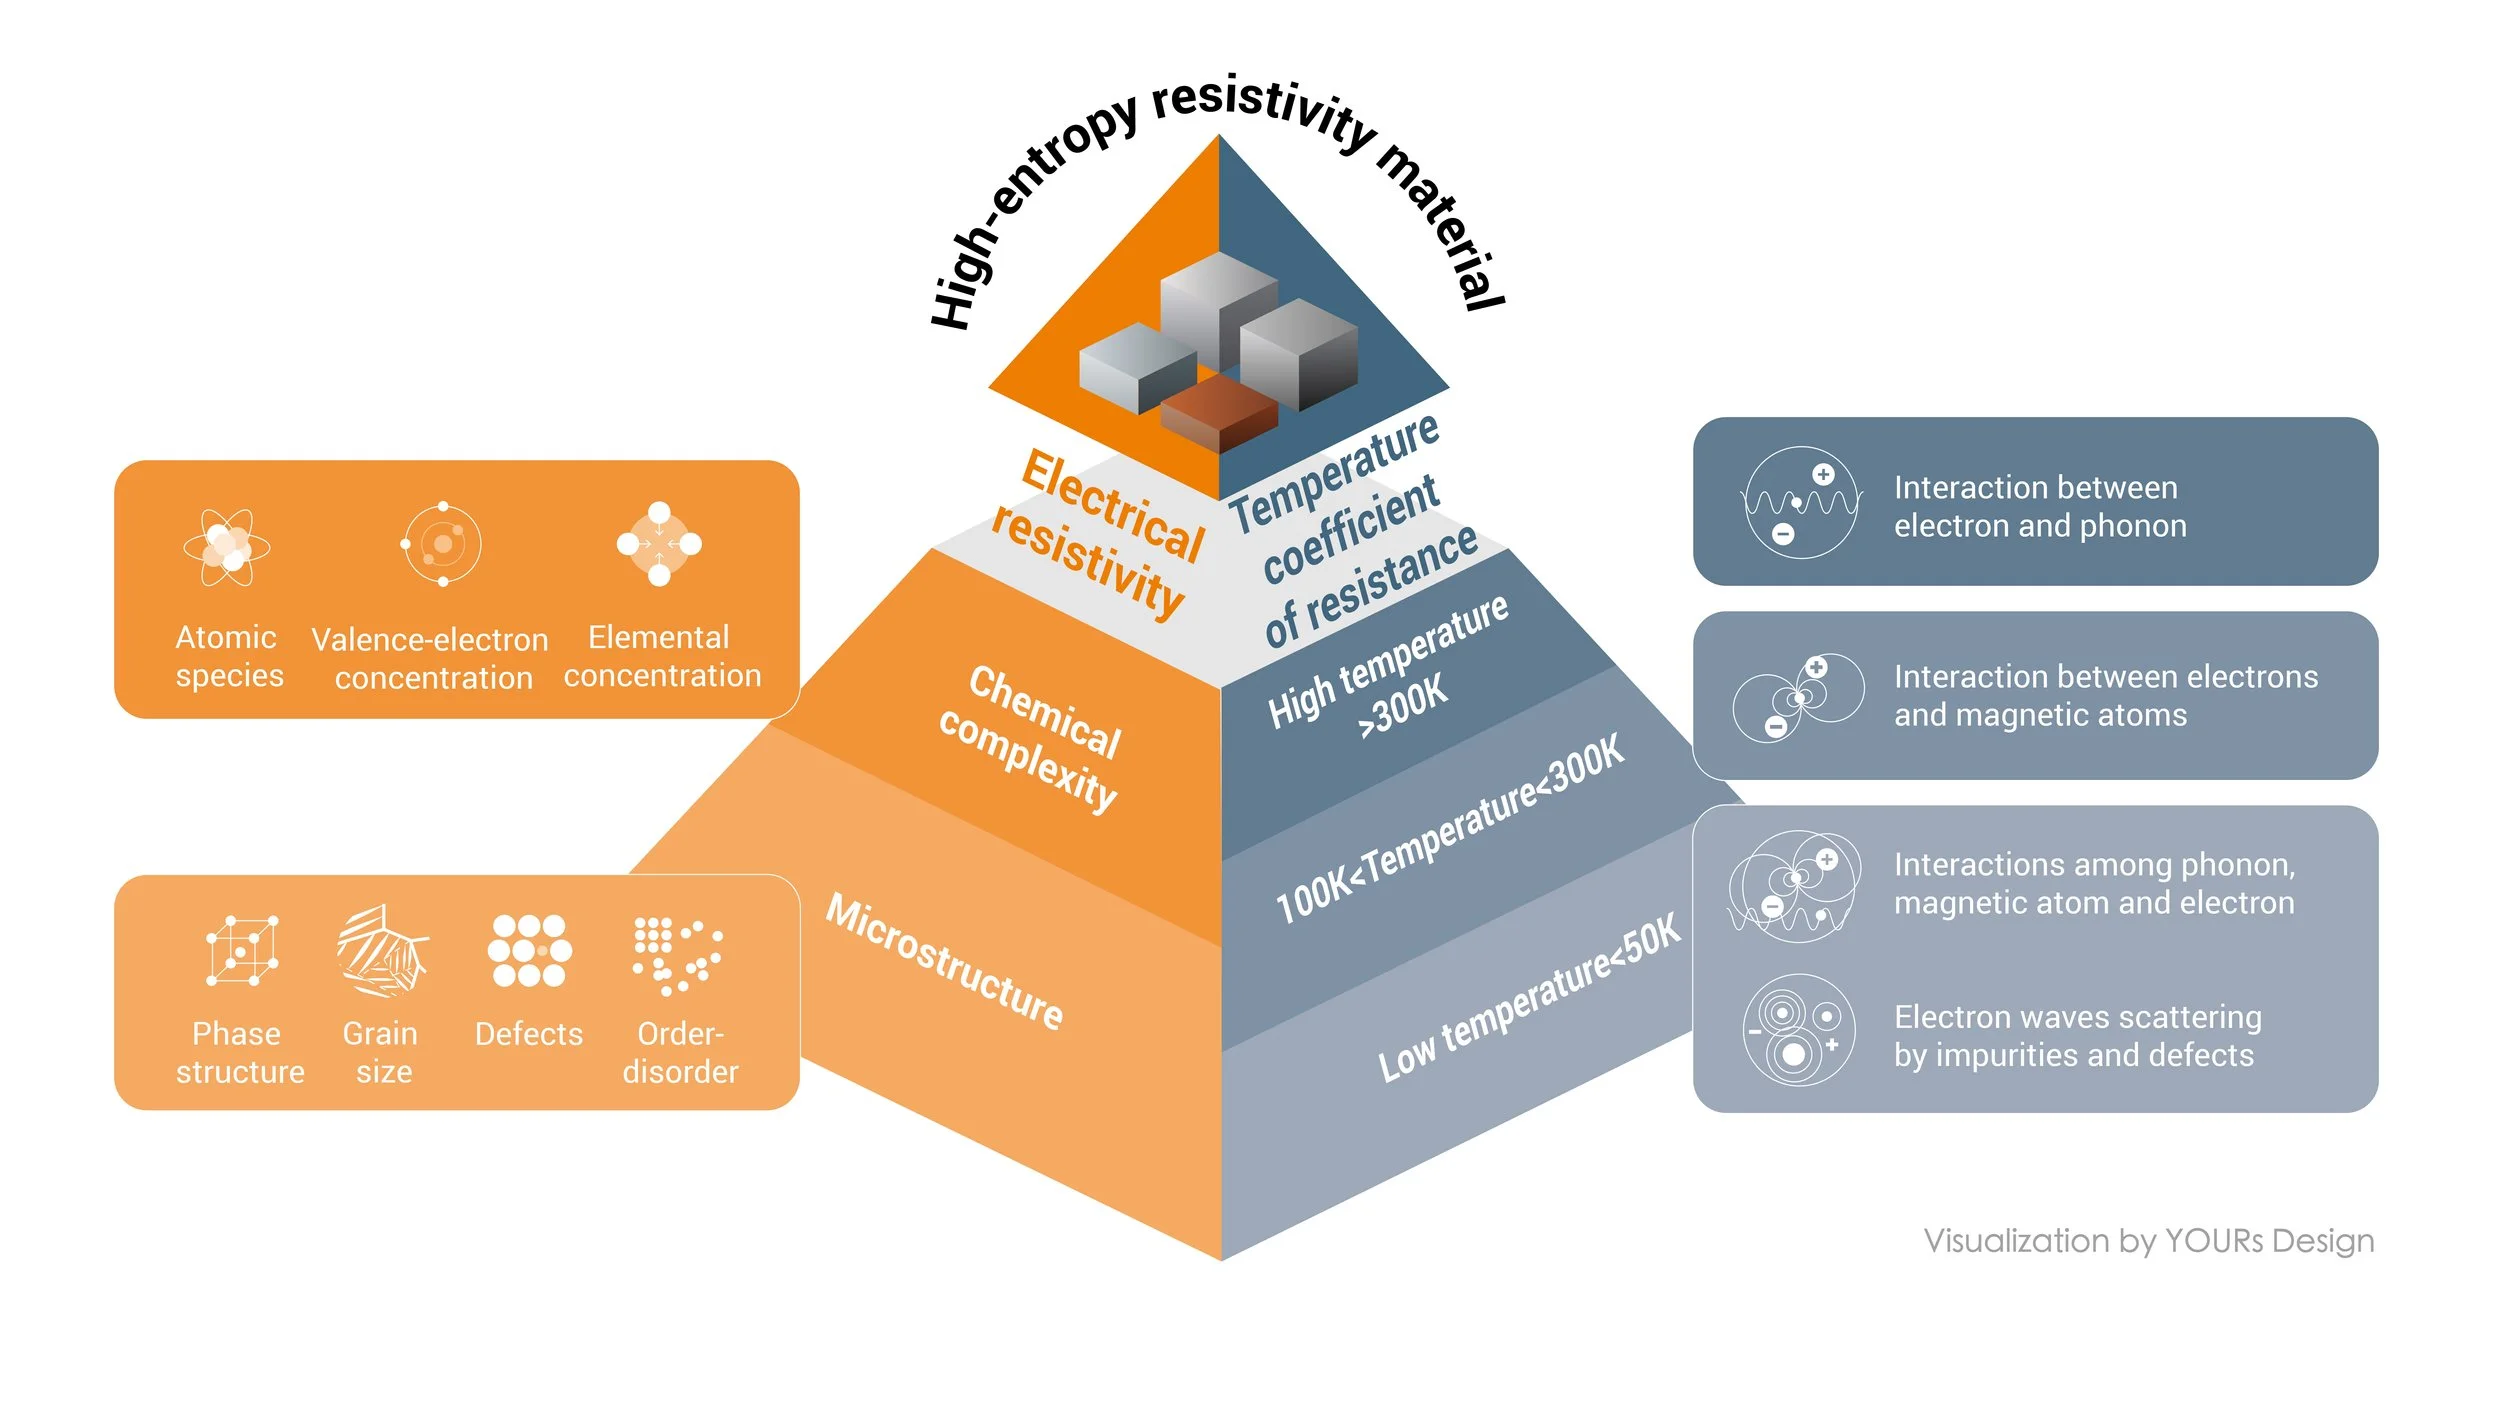
Multifunctionality of high entropy alloy → Research Publication
This work was created in collaboration with Max-Planck-Institut for sustainable materials. All rights reserved. Please do not reuse without permission.